For the collection of conformational constraints, a three-dimensional 15N-edited NOESY-HSQC and two 13C-edited NOESY-HSQC spectra for the aliphatic and aromatic regions (Muhandiram et al. 1993) were recorded with 80 ms mixing time.
Spectrum properties
Standardised name
C13NOESY_@ARO
Spectrum type
C13NOESY
FID available
no
Tags
@ARO
Folding/aliasing
Unspecified/other
Frequency axis definition
ID
Label
Frequency [MHz]
Range [ppm]
Data points
Source file
Database
Min.
Max.
ω1
C
C
201.248
109.663
134.998
128
ω2
HC
HC
800.350
5.467
7.966
368
ω3
H
H
800.350
-2.289
11.638
800
Experimental details
Spectrometer model
Bruker AV 800
Nominal 1H frequency
800.0 MHz
Isotope labeling
uniform 13C, uniform 15N
Sample concentration
1.100 mM
Temperature
297.00 K
Sample pH
6.00
System information
Total size (including converted files)
363.211 MB
Original format
Sparky
UUID in database
1fcec45a-1c26-4de0-bc4e-f76b6caf2d97
UUID on disk
c69dff8139c047a9b2b6818d18f3415f
Spectrum projections
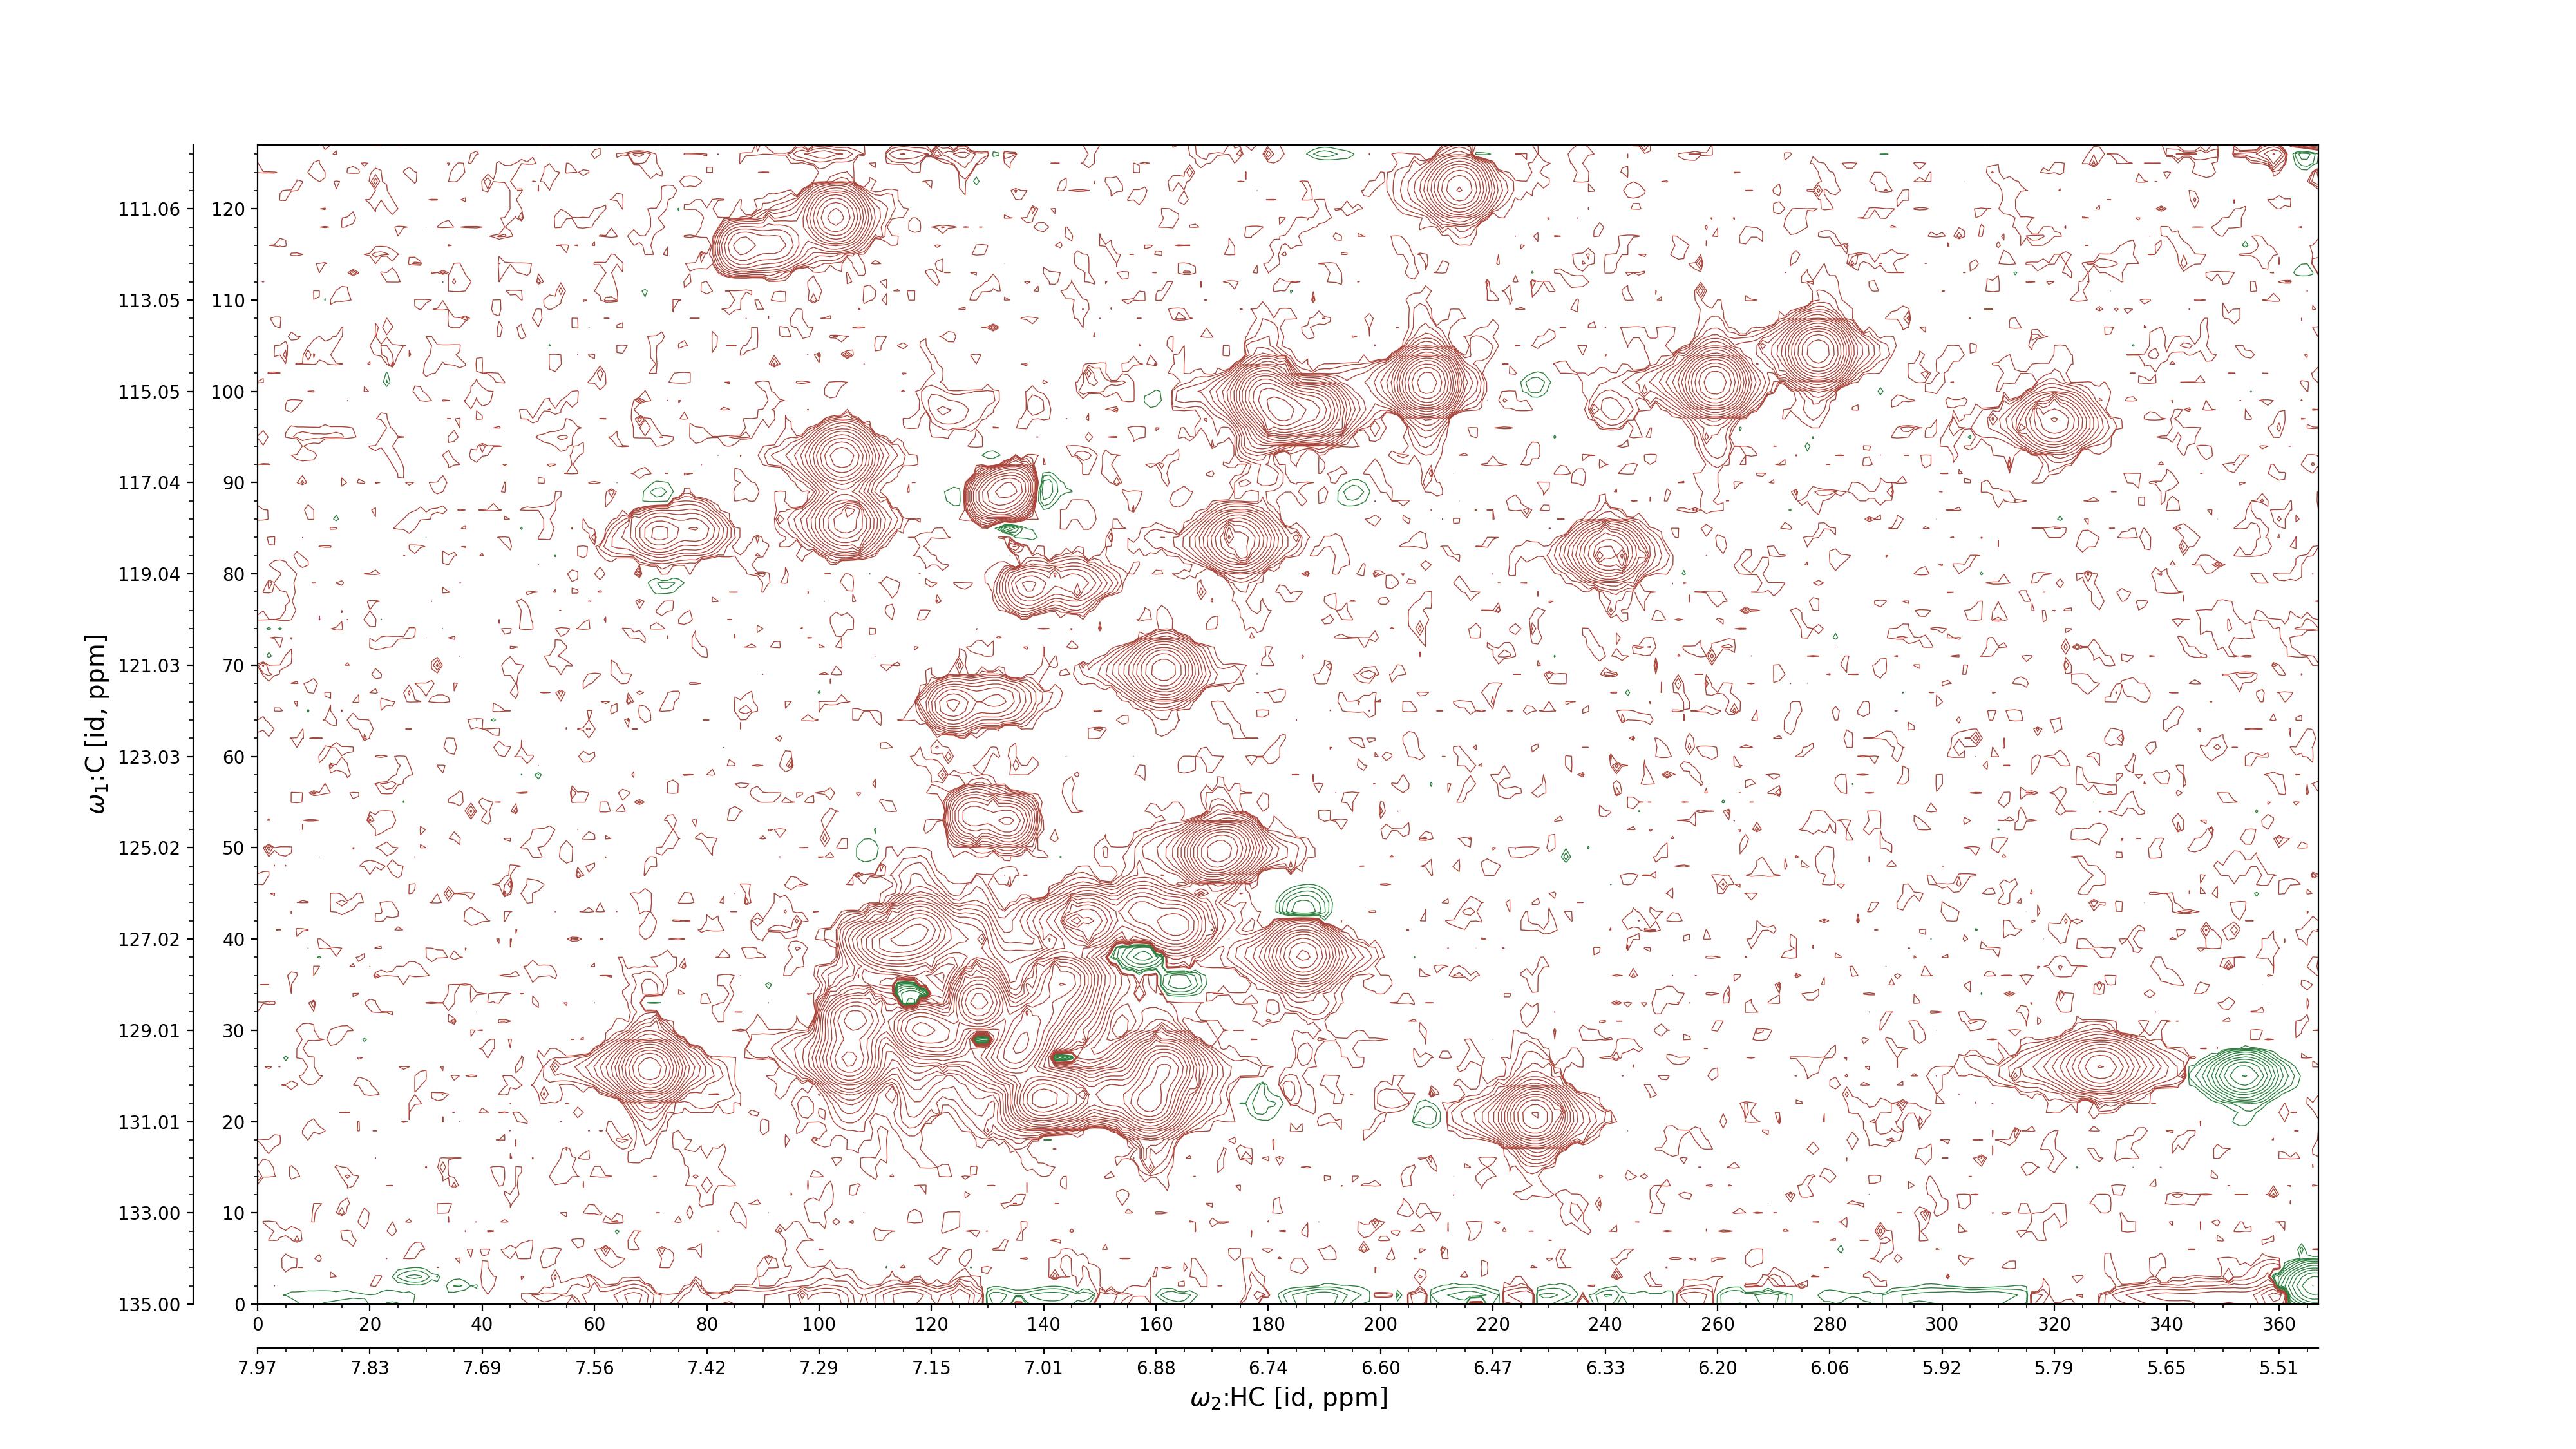
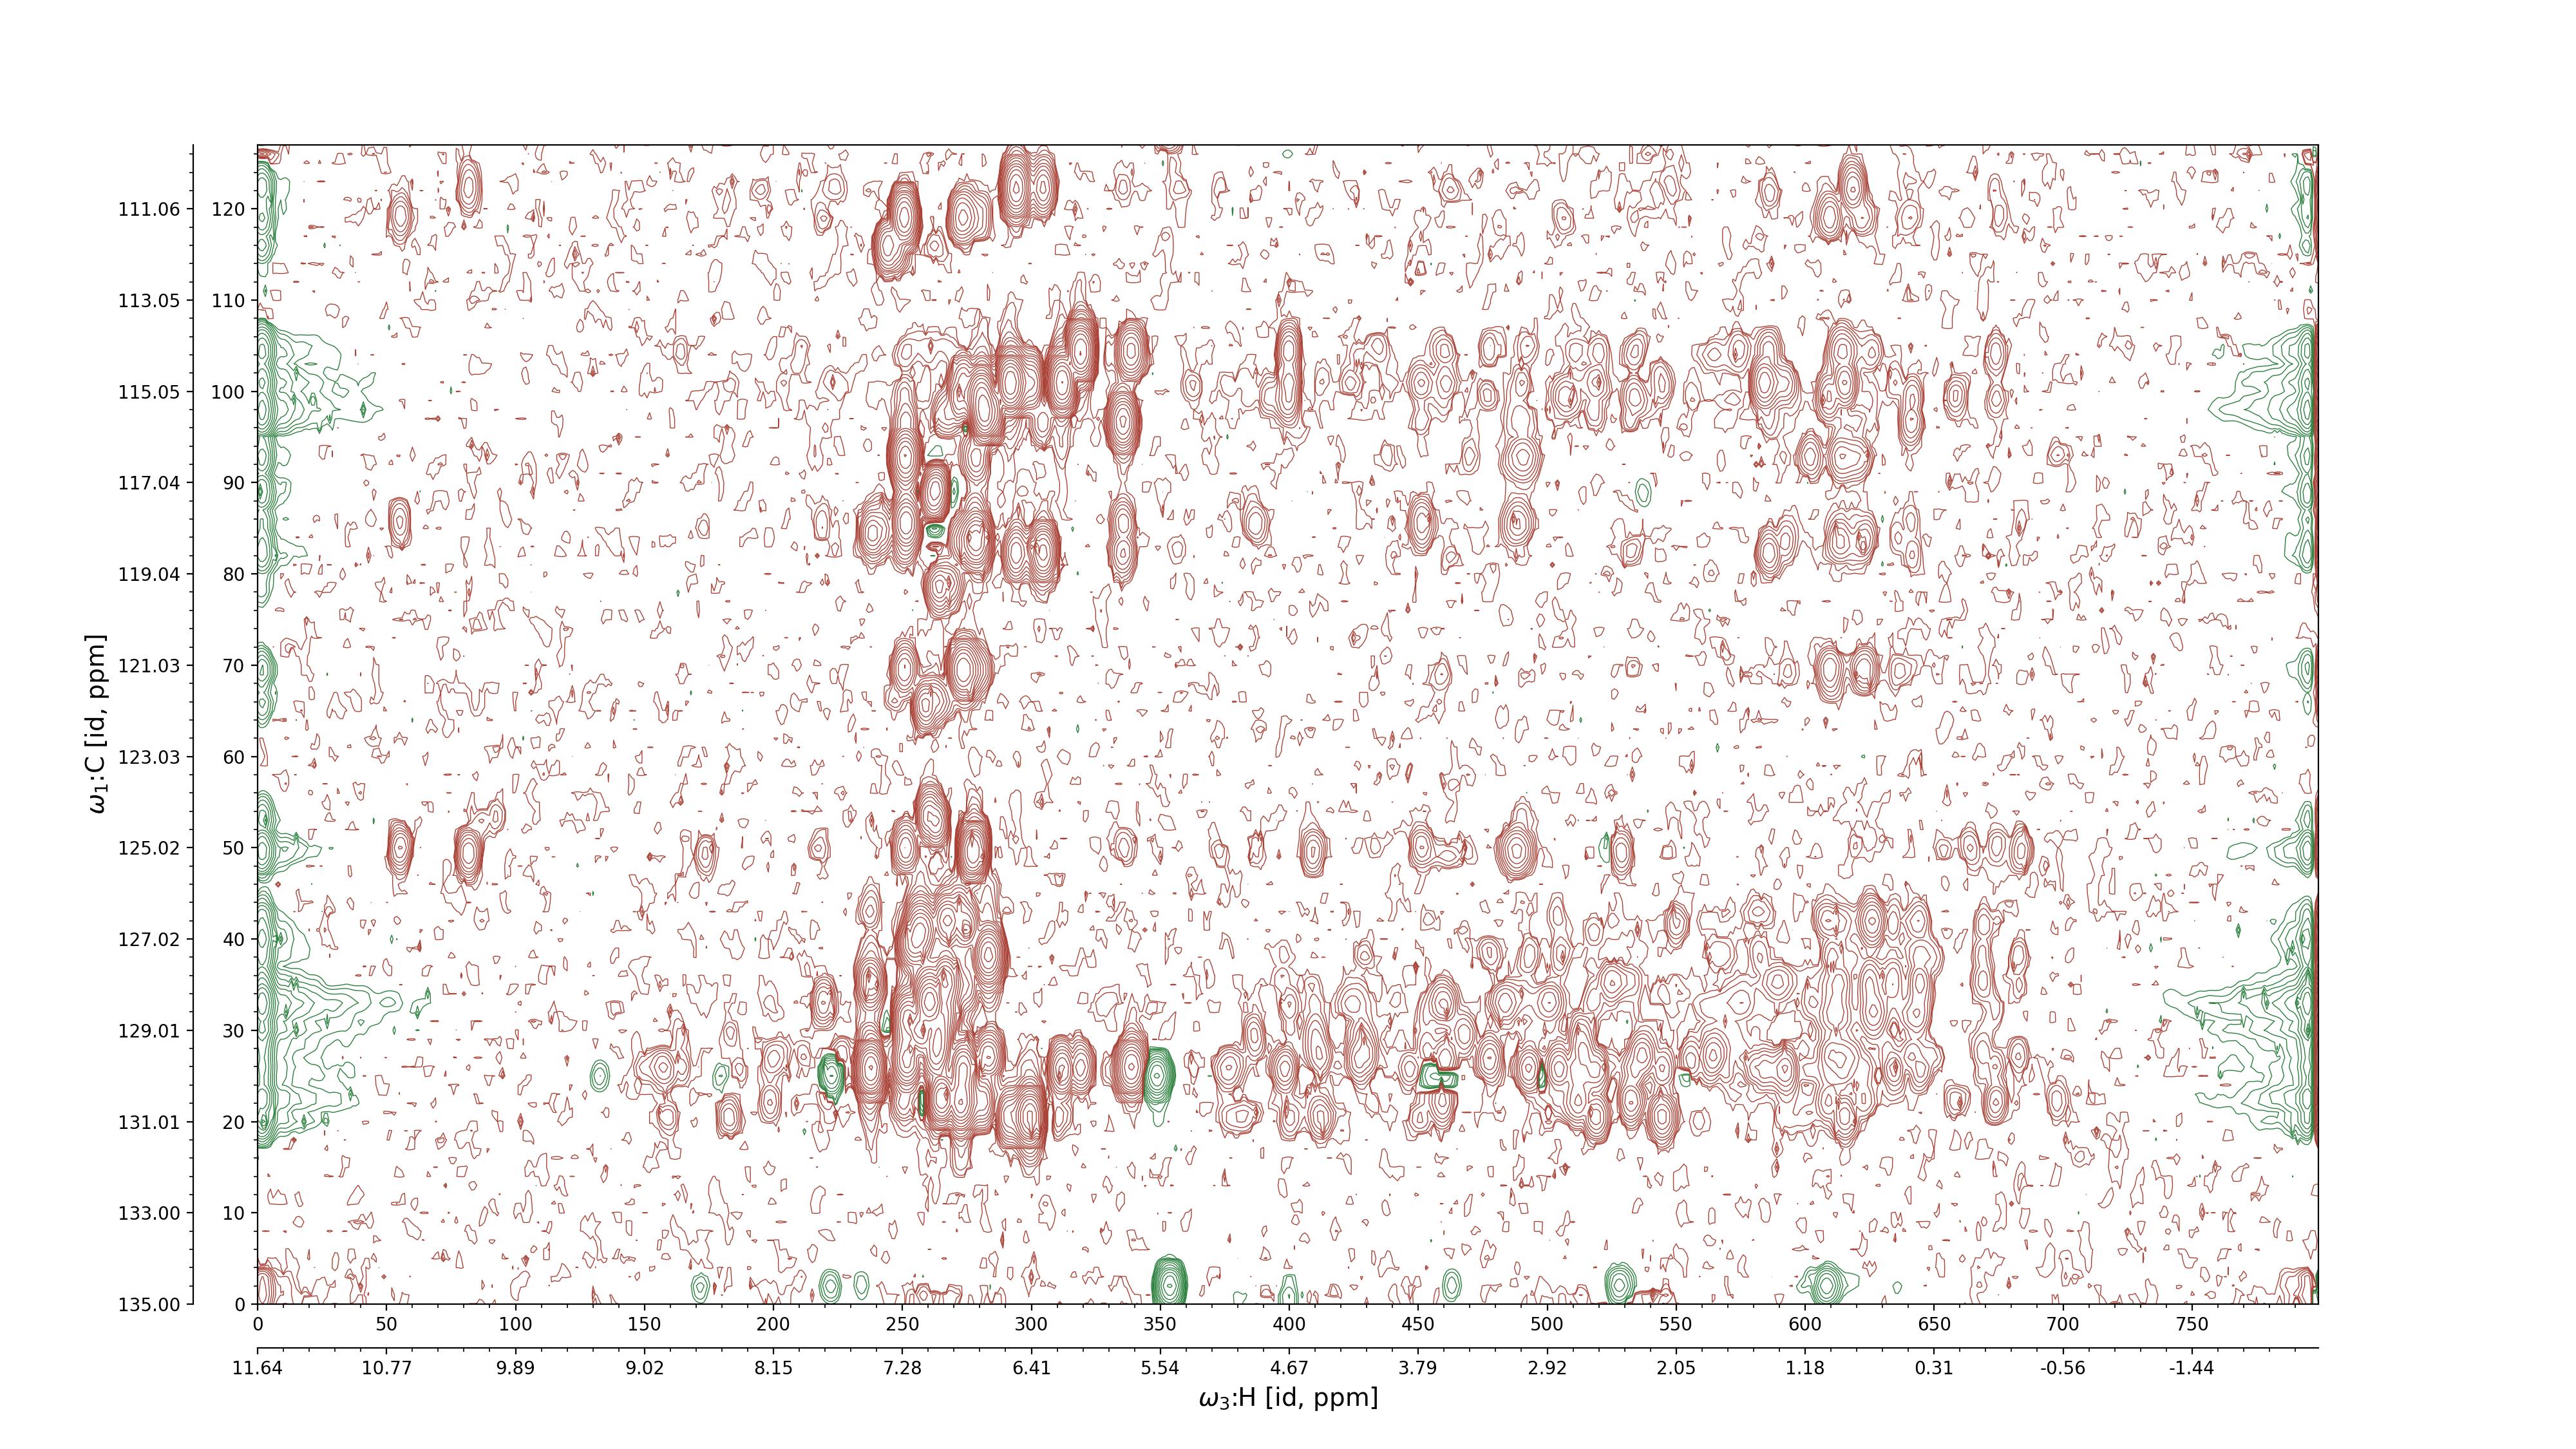
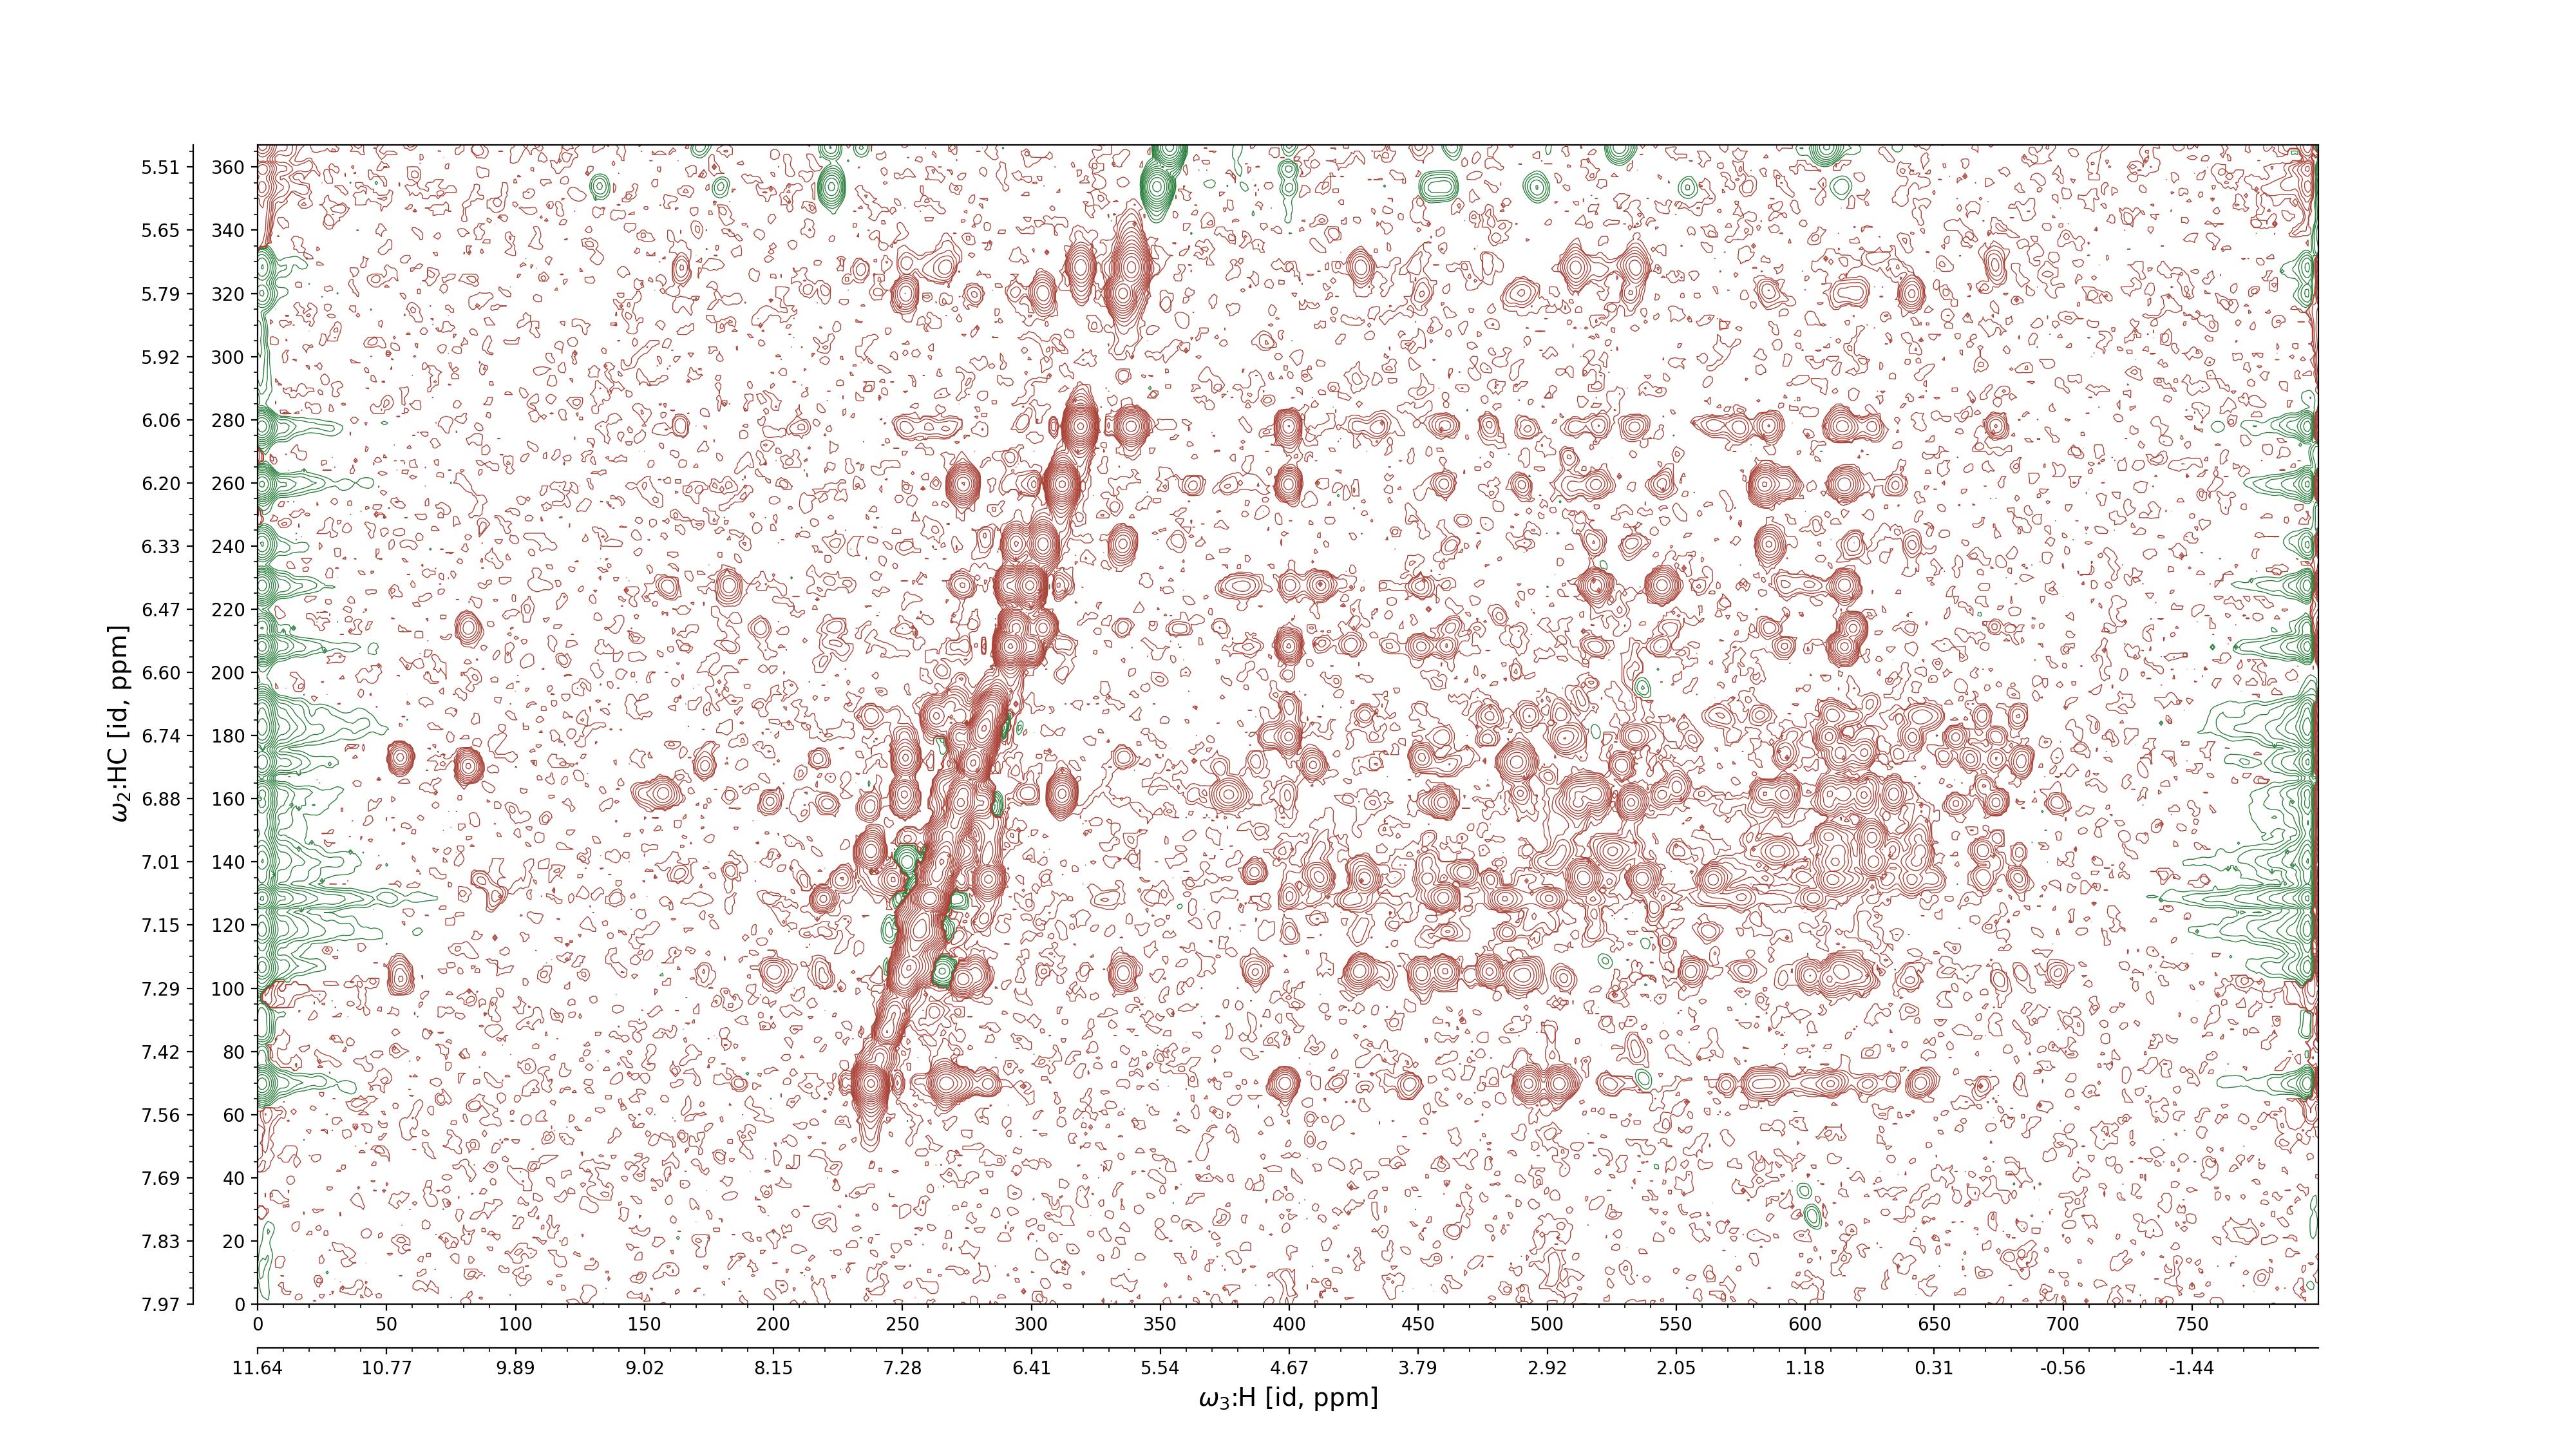
The images displayed below represent projections of the uploaded spectrum along each dimension.
Hint: Press image to open visualization in Full HD resolution.